All published articles of this journal are available on ScienceDirect.

Production of Bacteria Cellulose from Hydrolysate of Banana, Sago, and Potato Wastes
Abstract
Introduction
This article studies the bacterial cellulose (BC) produced using hydrolysates obtained from three Malaysian domestic agricultural wastes which are banana peels, potato peels, and sago effluent.
Methods
The wastes were hydrolysed using sulphuric acid at concentration of 4% (v/v) or 6% (v/v) for 20 minutes at two different temperatures, 105°C and 121°C, before being used as a carbon source in a culture media for the production of BC.
Results
Banana peel hydrolysate produced the highest BC yield (2.89 g/L) compared to potato peel hydrolysate (2.42 g/L) and sago effluent (0.38 g/L). However, the potato peel hydrolysate contains a higher glucose concentration (43.44 mg/mL) than banana peel hydrolysate (19.15 mg/mL). It was investigated that pH 6 as the initial pH of fermentation media and 2.0% of initial carbon source concentration are the best conditions for the fermentation of BC using banana peel hydrolysate as a carbon source. The morphology of BC produced from banana peel hydrolysate captured by SEM has ultrafine fibrils and a pore-like reticulated structure, similar to BC produced from standard HS media.
Conclusion
This study showed that banana peel hydrolysate is a promising carbon source for BC production, yielding the highest BC yield with desirable characteristics. In addition, the optimal fermentation conditions were identified in this study, which is useful for large-scale or industrial production.
1. INTRODUCTION
Bacterial cellulose (BC) is a biopolymer produced by bacteria from various strains, such as Komagataeibacter, Rhizobium, Acetobacter, Agrobacterium, and Sarcina [1-3]. BC is a unique polymer with good crystallinity, excellent mechanical strength, and high water-holding capacity. In addition, BC is pure cellulose. Compared to plant cellulose, which contains lignin, pectin, hemicellulose, and other compounds, BC does not require any purification methods to recover pure cellulose [4]. These characteristics made BC the center of attention for applications in food, medicine, and cosmetics [4-10].
The primary carbon source for BC production was glucose [3, 11]. Later, researchers shifted to using other saccharides and alcohol [8] as carbon sources for fermentation. In the food industry, BC is produced in nata de coco from coconut juice [5]. Hence, this pioneered BC production from various juices such as date, orange, pineapple, apple, pear, and other fruits [12, 13]. From here, researchers also explored the usage of agricultural waste such as rice, wheat, corn, sorghum, barley, cotton, groundnut, jute, legumes, and palm oil for the production of BC [14-16].
Malaysia's three abundant agricultural biomass wastes are bananas, potatoes, and sago. Banana is the second most produced fruit in the world, next to citrus, and is identified as one of the primary exports in Malaysia [17]. In Malaysia, a small banana processing facility can produce up to 27.15 kg of banana peel waste per month, the highest waste produced among other crops in the same facility [18]. Potato peels are not the highest agricultural waste recorded in Malaysia, but they contain a lot of starch, cellulose, hemicellulose, and lignin, which have been utilized by many studies to produce high-value products [19, 20]. It was estimated that potato peels account for about 73.3% of total carbohydrates [21], and these high carbohydrate contents can be utilized for BC production. Meanwhile, in East Malaysia, the sago starch production facilities generated approximately 1000 m3 of effluent per day for the production processes [22]. Since the effluent contains sago pitch and starch, it can be used as a carbon source for BC production.
The abundant amount of these three wastes in Malaysia from various agricultural sectors can be utilized as carbon sources for BC production. One way to do this is to convert the carbohydrates in the agricultural wastes into simple sugars such as glucose via hydrolysis. Acid hydrolysis is one of the best options for converting starch and lignocellulose into simple sugars as the process is cheap, simple and effective with a readily available catalyst [23, 24]. Important parameters that need to be observed for acid hydrolysis are temperature, acid concentration, and reaction period [25].
In this study, acid hydrolysis is used to convert agricultural wastes into glucose and simpler carbohydrates, which can then be used as carbon sources to produce BC. The strain used in this study is Acetobacter xylinum 0416, isolated by the Malaysian Agricultural Research and Development Institute (MARDI). The production of BC from three different carbon sources, which were sago effluent, banana peel, and potato peel hydrolysate was investigated in this study. Then, the BC was analyzed for its characteristics using SEM, TGA, and FTIR.
2. MATERIALS AND METHODS
2.1. Cultivation
Acetobacter xylinum 0416, used for this study, was obtained from the Malaysian Agricultural Research and Development Institute (MARDI). Hestrin and Schramm (HS) medium was used to produce seed cultures, which are composed of 2% (w/v) glucose, 0.5% (w/v) yeast extract, 0.5% (w/v) bacto-peptone, 0.27% (w/v) disodium hydrophosphate, and 0.115% (w/v) citric acid [11]. The cultivation method was followed by Lotfiman et al. [12], where the seed culture was prepared in a 250 ml conical flask with an initial pH of 6. The seed culture medium was then sterilized before being inoculated with 10% (v/v) of cell suspension culture obtained from MARDI. The seed culture was incubated at 30°C and left for 3 days.
2.2. Preparation of Hydrolysate
The diluted acid hydrolysis method used in this study was based on the study by Aguilar et al. [26]. 4% (w/v) and 6% (w/v) of sulphuric acid were used to hydrolyze the waste at a ratio of 1:10 (w/v). The hydrolysis reaction was performed at 105°C or 122°C for 20 minutes in an autoclave machine. Then, the autoclaved beaker containing the hydrolysate was immediately quenched in an ice-water bath [27] after autoclaving. The pH of the mixture was adjusted by adding sodium hydroxide (NaOH). The glucose concentration for each hydrolysate was analyzed using HPLC (Agilent, USA) with RCM-Monosaccharide Ca+2 8% column (Rezex, USA).
2.3. Fermentation
Three hydrolysates derived from sago effluent, potato peel, and banana peel using acid hydrolysis were used as carbon sources to produce BC. These hydrolysates replaced the glucose content in the HS medium. 10% (v/v) of seed culture was inoculated in the modified medium with an initial pH of 6.0. The incubation was conducted at 30°C for 21 days. The preliminary study indicates that banana peel produced the highest yield of BC. Therefore, it was used as a main carbon source in this work. As illustrated in Table 1, the parameters were selected and operated for 21 days incubation time.
| Conical Flask | pH | Carbon Source (%) |
|---|---|---|
| BH1 | 5 | 0.5 |
| BH2 | 6 | 0.5 |
| BH3 | 7 | 0.5 |
| BH4 | 8 | 0.5 |
| - | - | - |
| BH5 | 5 | 1 |
| BH6 | 6 | 1 |
| BH7 | 7 | 1 |
| BH8 | 8 | 1 |
| - | - | - |
| BH9 | 5 | 2 |
| BH10 | 6 | 2 |
| BH11 | 7 | 2 |
| BH12 | 8 | 2 |
2.4. Preparation of Dried BC
Harvesting of the BC was conducted using the method described by Hwang et al. with some modifications [28]. The BC was washed with distilled water and then soaked and boiled in 0.5 M sodium hydroxide (NaOH) solution for 30 minutes to kill and eliminate the bacteria on the BC [11, 12]. Then, the sheet was soaked in distilled water overnight to remove the remaining NaOH. The BC was dried at room temperature until a constant weight was obtained. The dry weight of the pellicle was recorded to report the BC yield. Yield was calculated as dry weight over culture volume or nutrient volume.
2.5. Characterization
A scanning electron microscope (SEM) was conducted to observe the fibrils' BC structure, morphology, and diameter [29]. The SEM model used in this work is S-3400 (Hitachi Ltd., Japan). BC was freeze-dried, cut into small pieces, and gold-coated for 3 minutes under vacuum conditions. It was operated at 5.00 kV at a magnification of 10000.
A thermogravimetric analyzer (TGA), a thermal weight change analysis instrument, was used to determine the thermal stability of the product. TGA analysis was conducted using a Mettler Toledo (Switzerland) instrument. Approximately 8 mg of BC sample was kept in a crucible and heated in a furnace. The flow rate of inert gas, pure nitrogen, was set at 10 ml min-1. The sample was heated from 25°C to 900°C at 10°C min-1. The decomposition temperatures and associated weight loss were determined based on raw and derivative data obtained.
The chemical structures using the existences of functional groups in the samples were identified using FTIR (Nicolet Nexus 470, USA) technique with an attenuated total reflectance (ATR) mode in the range between 4000 to 800 cm-1 averaging 64 scans at a resolution of 8 cm-1 was operated to analyze the sample. Each air-dried BC sample in the form of a thin film placed across a hole in the sample holder before analyzed.
2.6. Statistical Analysis
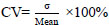
Glucose concentration and BC yield measurement were conducted with duplicates. The mean and standard deviation (σ) were computed using Microsoft Excel. The coefficient of Variation (CV) was calculated to check the variability of the replicate samples from the mean value using the Eq. (1) below:
 |
(1) |
Using Aronhime et al. (2014) as a reference, CV ≤10% was considered excellent reproducibility and low variability, CV between 10–20% was considered moderate variability, and CV >30% was considered low variability and poor reproducibility [30].
3. RESULTS AND DISCUSSION
Hydrolysis of sago effluent, potato peels, and banana peels was conducted using 4% and 6% H2SO4 at 105°C and 121°C. This range was chosen based on the range used by Aguilar et al. (2002) [12]. The reaction converts lignocellulosic and starch materials into simple sugars [31], such as glucose, which Acetobacter xylinum will use to produce BC. Fig. (1) below shows that the hydrolysis reaction on potato peels produces more glucose than other wastes. Hydrolysis conducted at 121°C for peels produces higher glucose concentration than at 105°C because high temperature can facilitate the breakdown of hemicellulose to cellulose, thus increasing the amount of cellulose to be converted to glucose in the hydrolysate [32].
Compared to potato and banana peel waste, which typically contain 46%-52% of starch [33-35] and 12% to 30% of starch [36-38], the starch content in sago effluent is much lower. Awg.-Adeni et al. mentioned that sago wastewater contains 94%-97% water and the rest is hampas [39]. Two different sources have reported that hampas contain 49% starch and the rest is lignocellulose [40, 41]. Acid hydrolysis targets these starches and converts them to glucose. Since the starch concentration in sago effluent was small, the hydrolysis product from this waste yielded the lowest glucose concentration.
Hydrolysates with the highest glucose concentrations from the previous experiment were used as carbon sources for BC production: sago effluent (1.68 mg/mL), potato peel (43.65 mg/ml), and banana peel (19.15 mg/ml). Despite the higher glucose concentration in potato peel hydrolysate, banana peel hydrolysate produced the highest BC yield after 21 days with 2.89 g/L, which is 1.2 times and 7.6 times higher than potato peel (2.42 g/L) and sago effluent (0.38 g/L), respectively. The lower BC yield from sago effluent is due to insufficient glucose, while potato peel's high glucose leads to excess gluconic acid formation, lowering the pH and reducing BC production. This confirms that an optimal glucose concentration is necessary for high BC yield, as supported by Masaoka et al. [42] and Jeff Sumardee et al. [43]. Both groups agreed that a high initial glucose concentration causes the excess glucose to be converted to gluconic acid during fermentation [42, 43]. Formation of a high amount of gluconic acid causes the pH of the media to drop, thus decreasing the BC yield; this statement is supported by the two groups and a study from Oikawa et al. [44]. A review from Zikmanis et al. (2021) [45] commented that a growth environment below pH 5 inhibits the growth of the bacteria and causes a reduction in BC yield. This explains the lower BC yield from potato peel hydrolysate despite its higher glucose concentration than banana peel hydrolysate (Fig. 2).
Carbon source concentration plays a vital role in BC production. Several researchers found different carbon source concentrations that enhance BC production. Keshk et al. [8] found that 1.0% of glucose as carbon source concentration is the optimum condition for BC production, while Pourramezan et al. (2009) and Son et al. found it as 1.5% of sucrose and glucose respectively [46, 47]. Many authors suggested 2.0% of glucose as a carbon source concentration for their BC production [2, 11, 28].
Banana peel hydrolysate gives the highest BC yield among those hydrolysates, so it was chosen as a carbon source in this study. According to the HPLC result, the highest glucose was found to be 19.15 mg/ml, which can be defined as almost 2.0% from the culture medium. Therefore, it was used as a stock solution and diluted into 0.5% and 1.0% to find the suitable carbon source concentration for BC production.
For all glucose concentrations, four different initial pH levels were selected: 5, 6, 7, and 8. The typical pH for BC production is 4-7 [48, 46]. Before that, it was investigated and found that at initial pH 3 and 4, the amount of bacterial cellulose produced was low. From the result illustrated in Fig. (3), which is according to the dry weight of BC, pH 7 is the optimum among others for 0.5% and 1.0% of glucose concentration, where 0.65 g/L and 1.12 g/L of BC can be produced, respectively. For 2.0% of glucose concentration, pH 6 was found as the optimum pH for BC production, producing about 2.93 g/L of BC, which is 4.5-fold and 2.6-fold higher than 0.5% and 1.0% of glucose concentration, respectively.
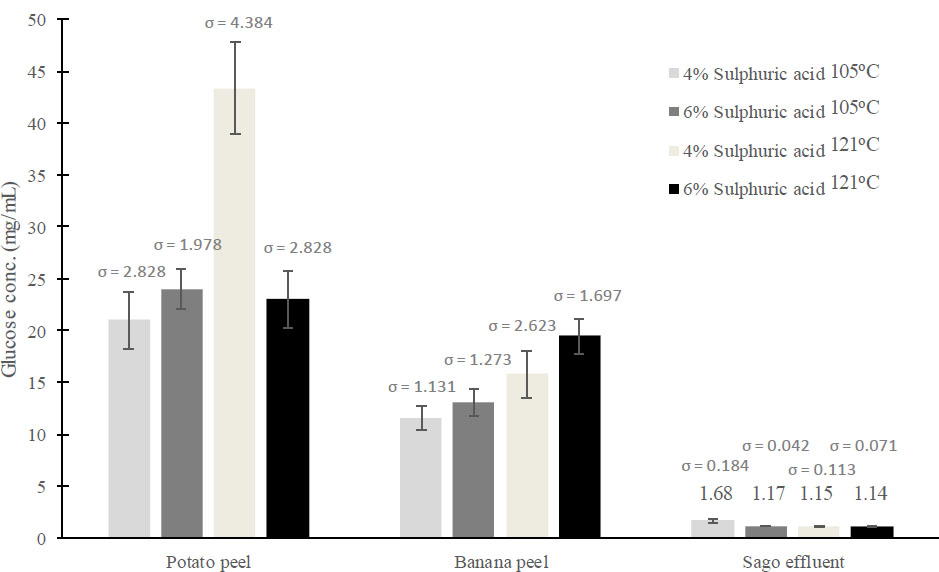
Glucose concentration from acid hydrolysis reaction using three different wastes at two sulphuric acid concentrations and two reaction temperatures.
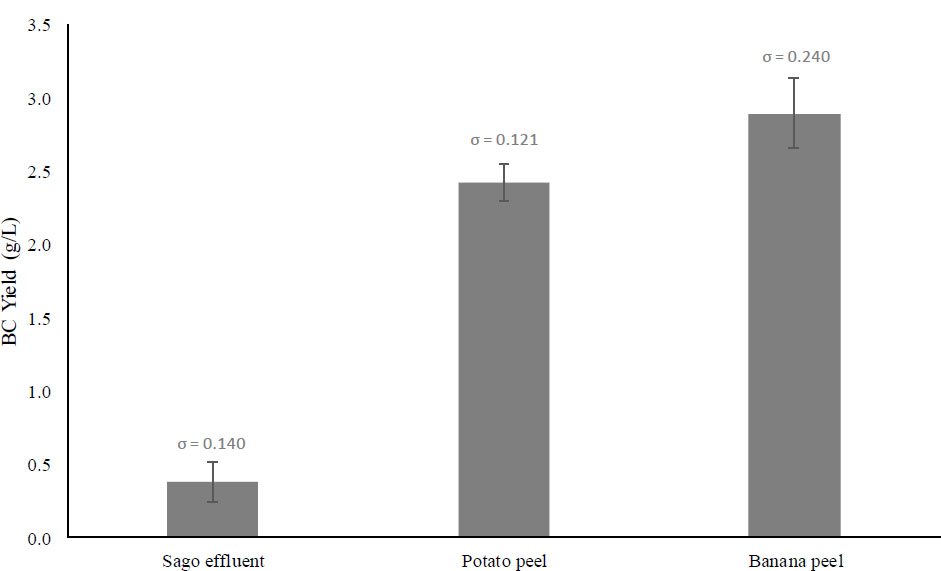
Dry weight (g/l) of BC fermented from sago effluent, potato peel, and banana peel.
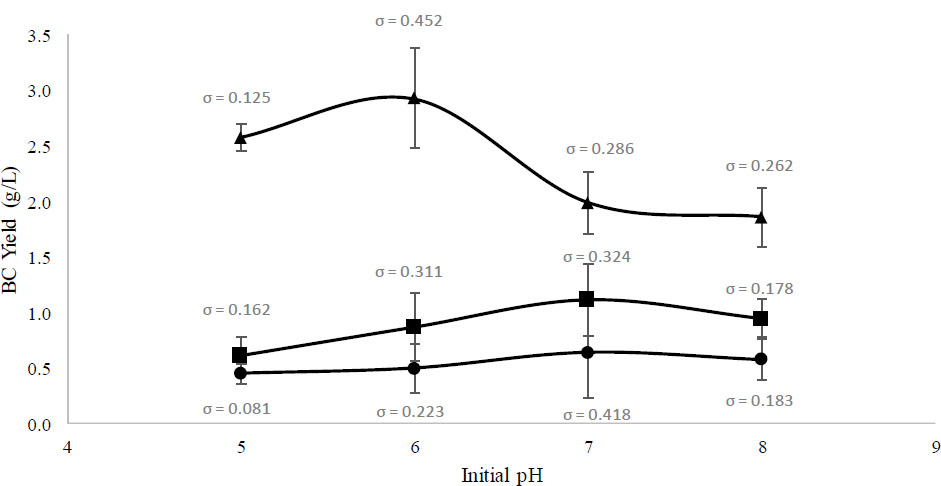
Dry weight of BC at different initial pH for (●) 0.5%, (■) 1.0% and (▲) 2.0% of glucose as carbon source concentration after 21 days of incubation.
The initial pH of the media plays a crucial role in maximizing the BC yield. The optimum initial pH requirement is different from strain to strain [49], and in this study, Fig. (3) showed that optimum pH also depends on the concentration of glucose as a carbon source in the media. A 2% carbon source is the standard glucose concentration in HS media and is commonly used in growing BC. Masaoka et al. (1993) have proven that 2% is the optimal glucose concentration that provides the highest BC yield when cultivating A. xylinum, which aligns with this study [42]. In addition, media with an initial pH of 6 resulted in the highest BC yield, which also aligned with the result from Masaoka et al. (1993) [42]. However, there were not many references that explain the dependency of glucose concentration on the optimal initial pH of media. Fig. (3) below shows that low glucose concentrations at 1% and 0.5% caused the optimum initial pH of the media to switch to pH 7. Since there was not much literature to explain this phenomenon, we can look at a study from Hutchens et al. (2007), where switching the carbon sources in the media from glucose to mannitol would cause the optimal initial pH to switch from pH 5.5 to pH 7 for Gluconacetobacter hansenii [50]. The switch in carbon sources implies that glucose starvation causes a shift in the bacteria’s metabolism. Similar to this study, low glucose concentration at 1% and below would eventually shift the bacteria’s metabolism and cause the bacteria to produce a slightly higher BC yield at pH 7 compared to pH 6. However, a thorough metabolism study that looks at various genes in A. xylinum being turned on and off during the glucose starvation process should be conducted in the future to explain this phenomenon adequately.
3.1. Statistical Analysis
Fig. (1) reports that potato peel hydrolyzed at 121°C resulted in the highest glucose concentration (~43.65 mg/mL), followed by banana peel hydrolysate (19.15 mg/mL) and sago effluent. The standard deviations (σ) reported variations in glucose concentration measurements across different hydrolysis conditions. The highest standard deviations (σ = 4.384) were reported for potato peel hydrolysis using 4% sulphuric acid at 121°C. However, the value is relatively small compared to the mean, which is 43.4 mg/mL glucose, approximately 10% of the coefficient variation (CV) value. This implies that most hydrolysis samples are close to the mean value and have low variability from each replicate. Fig. (2) reports that media containing banana peel hydrolysate produced the highest BC yield (2.89 g/L). Again, most of these samples had low CV values. Hence, most samples had values close to the mean and low variability from each replicate. Lastly, Fig. (3) shows a strong correlation between initial pH, glucose concentration, and BC yield, suggesting that there is a metabolic shift in response to nutrient availability, thus causing the optimal initial pH to shift to pH 7 from pH 6. The standard deviations (σ) ranged from 0.081 to 0.452, indicating a moderate variation in BC production, with CV value for some data to be higher than 10%. However, most of the data in this study has low standard deviations (σ) and low CV values, indicating that most yield values are close to the mean and have high reproducibility of results.
3.2. BC Characterization
3.2.1. Morphology of BC
The morphology of BC was observed under a Scanning Electron Microscope (SEM) and presented in Fig. (4a-d). The result shows that the BC produced from banana peel hydrolysate is similar to that produced in HS medium culture produced by [7]. It has irregular ultrafine fibrils and a crossed and pore-like reticulated structure [51]. In addition, it can be seen that tunnels exist where it is needed by the bacteria for the sufficiency of their movement [51, 52].
Çoban and Biyik reported that when a different type of carbon source is used, the morphology of BC produced also changes [53]. Thus, in this study, even though BC was produced from different initial concentrations of glucose, it was found that there is no difference in morphology in terms of fibrils’ size for each BC. This might be due to the same type of sugar existing in each hydrolysate. BC produced from banana peel hydrolysate has microfibrils’ size in the range of approximately 50-100 nm, following a previous study [54-56].
3.2.2. Thermal Stability of BC
Thermogravimetric analysis (TGA) was performed on dry BC to study its thermal stability. From the result obtained, as illustrated in Fig. (5), three distinct points can be observed in the weight loss of BC. The same pattern can be observed for 1.0% and 0.5% carbon source concentrations. The first stage of weight loss is an endothermic
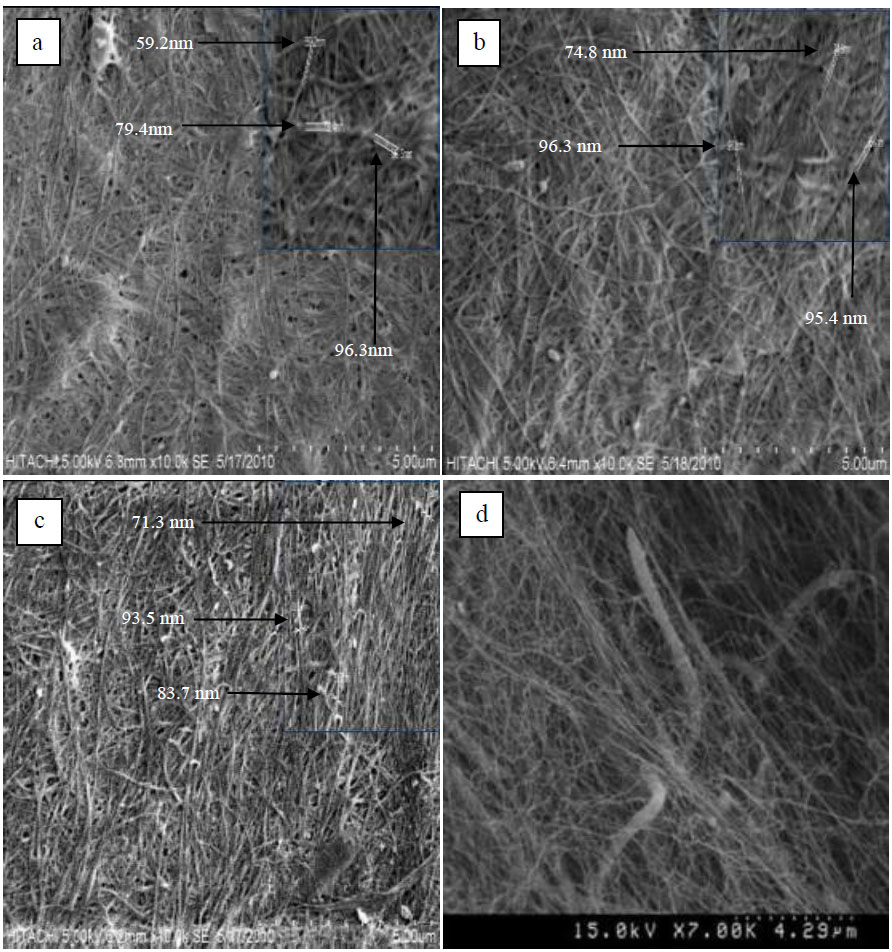
BC structure under SEM. (a) 0.5% carbon source, pH 7, (b) 1.0% carbon source, pH 7, (c) 2.0% carbon source, pH 6, and (d) BC from HS medium [51].
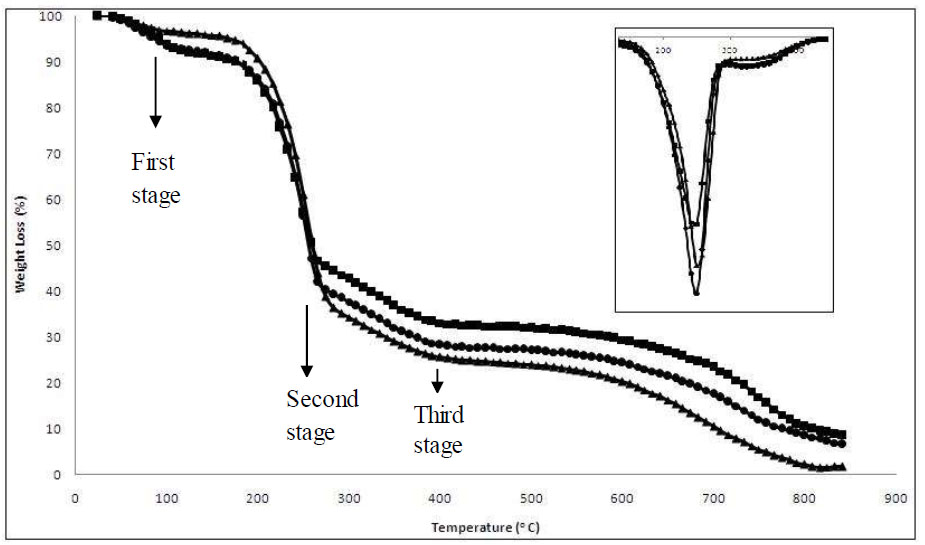
The TGA curve of BC for (▲) 0.5% carbon source concentration and pH 7, (■) 1.0% carbon source concentration and pH 7, and (●) 2.0% carbon source concentration and pH 6 after 16 days of incubation period. Inset is the DTG curve for each condition.
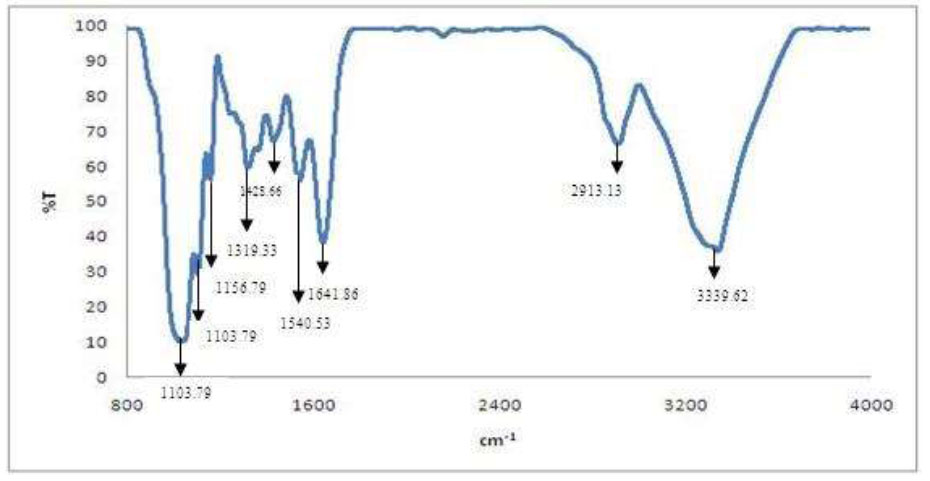
FTIR spectra of BC.
process, namely dehydrocellulose [57]. It can be seen around 100 °C, indicating the loss of moisture entrapped in the microfibrils of BC. According to Cheng et al., the weight loss found in the range of 200 °C to 360 °C indicates the removal of small molecular fragments such as hydroxyl and methylhydroxyl groups [58]. In this stage, a depolymerisation reaction took place and yielded levoglucosan (1,6-anhydro-ß-D-glucopyranose) as an essential intermediate. This study found this stage at 250°C, as illustrated in the inset image in Fig. (5). The third weight loss stage, which is almost from 400 °C until the end, represents the degradation of the polymeric chain and pyran, the six-member cyclic structure.
A few factors may affect the thermogravimetric measurement, including sample preparation. Sample size and homogeneity may affect heat transfer within the samples and consequently influence the diffusion rate of the reaction [59].
3.3. FTIR Analysis
Fourier Transform Infrared Spectroscopy (FTIR) was performed to study the molecular bonding in the BC produced from banana peel hydrolysate. By obtaining the percent transmission as a function of incident radiation wavelength, the FTIR result can provide the type of bond in the BC sample where the purity of BC can be investigated. As illustrated in Fig. (6), the functional group that exists in the BC was found to be similar to that found by Dobre et al. (2010) and Klemm et al. [7, 60]. The characteristic band of BC on the graph shows high absorption at 3339.62 cm-1, representing the existence of the hydroxyl (OH) group [61]. C-H stretching can be seen at 2913.13 cm-1 while 1428.66 cm-1 shows the presence of C-H bending vibration [60]. A band shown at 1641.86 cm-1 was attributed to the existence of the carbonyl (C=O) group in the BC [62, 63]. A band that exists at 1540.53 is attributed to C-C stretching [64]. At 1319.33, C-H wagging was identified [65]. C-O-C vibration can be detected at 1103.97 and 1156.79 [66] while fingerprint region at 1029.10 cm-1, C-O stretching was shown. From this result, it can be concluded that pure BC was produced using banana peel hydrolysate due to the similarity of the peak appearance with other’s work [7, 60, 63].
CONCLUSION
From this study, BC was successfully produced from the hydrolysate of wastes. Banana peel hydrolysate was found to produce the highest BC yield among other wastes. Initial pH 6 and 2.0% of carbon source concentration from banana peel hydrolysate were the best parameters for BC production. SEM images show that BC has small microfibrils and a crossed and pore-like reticulated structure. TGA results indicate that BC has three distinct points that can be observed in the weight loss process, namely dehydrocellulose, depolymerisation, degradation of the polymeric chain, and pyran removal. FTIR result shows that BC produced in this study has a common functional group for typical BC.
AUTHORS' CONTRIBUTIONS
The authors confirm contribution to the paper as follows: M.A.; writing manuscript and conduct experimentation; D.R. A.B.: conceptualizing and resouces; H.S.Z.: preparation of manuscript, reviewing, and analysis of data. All authors reviewed the results and approved the final version of the manuscript.
LIST OF ABBREVIATIONS
| BC | = Bacterial Cellulose |
| MARDI | = Malaysian Agricultural Research and Development Institute |
| HS | = Hestrin and Schramm |
| SEM | = Scanning Electron Microscope |
| TGA | = Thermogravimetric Analyzer |
| ATR | = Attenuated Total Reflectance |
| CV | = Coefficient of Variation |
AVAILABILITY OF DATA AND MATERIALS
The data and supportive information are available within the article.
FUNDING
This research was funded by Fundamental Research Grant Scheme number 5524195 from the Ministry of Higher Education, Malaysia.
ACKNOWLEDGEMENTS
The authors thank MARDI and Sciencefund for their support in this project.